5 Metrics and KPIs to Track the Effectiveness of User Onboarding. How to Track Them and Why?

Highlights:
5 Important Onboarding Metrics and KPIs to Track Performance
The ultimate goal for any SaaS company is to satisfy the requirements of the customer and to make the usage of your product pleasant, convenient and successful. All this way starts with a proper and perfect customer onboarding.
Onboarding sets the pace and provides product adoption. Therefore it is one of the most important keys to whether you win or lose. Lincoln Murphy once said:
"It is totally possible to plant the seeds of churn early, and that’s where an understanding of the process – and value behind – customer and user onboarding are so critical."
Right customer onboarding is not only about knowing user’s expected results, it’s also data and handy customer onboarding metrics. They should show your customers’ behaviors and interactions with your product in order for you to understand the strengths and weaknesses of your onboarding strategy.
What is User Onboarding?
When hiring new team members, one needs to find a convenient and quick way to help them understand and join current working processes. A successful experience interacting with a product or service is crucial for its effectiveness. It makes the whole atmosphere for their journey with the company, determining whether they will become long-term, satisfied customers or churn early on. Effective procedure is essential for SaaS companies as it directly impacts customer retention, engagement, and overall success. For this very reason, tracking onboarding KPIs and new employee onboarding metrics is so important.
5 Important Onboarding Metrics and KPIs to Track Performance
Tracking the right onboarding success metrics is vital to understanding its effectiveness and finding ways to make adjustments and changes for improvement. Let's explore five essential onboarding effectiveness metrics and KPIs:
1. Retention Rate
The Idea of this metric is to show how many people still use the product after a decided time, such as the first 30 days or the trial period. A high number indicates successful onboarding and satisfied users who find value in the product. To track retention rate, monitor customer onboarding statistics, user activity, and interactions over time to identify when and why users may stop using the product.
2. Engagement Rate
It shows how actively users interact with the product during their first steps. It includes metrics like login activity, feature usage, and content consumption. High engagement rates suggest that users find the product valuable and actively explore its capabilities. To track engagement rate, analyze user actions, and identify patterns of active usage versus passive behavior.
3. Free Trial Conversion Rate
The free trial conversion rate is an essential indicator for SaaS firms that provide free trials. It shows the percentage of those who, after trial, became customers. A high conversion rate implies that the work results are successful and the product's value proposition was well communicated throughout the trial. The formula analyzes the number of trial sign-ups vs the number of converted customers.
4. Completion Rate
It measures the people who complete the whole process. It includes activities like filling out profiles, completing tutorials, or finishing specific tasks. A high number signifies that users are effectively onboarded and understand the product. To track the completion rate, set clear milestones, and monitor user progress.
5. Time to Value (TTV)
This parameter estimates how much time users need to get the desired outcomes from the product. A shorter TTV indicates an effective procedure, as users can quickly realize the product's benefits. To track TTV, analyze user behavior and identify the critical steps or features that lead to value realization.
By consistently tracking these onboarding program metrics and KPIs, SaaS companies can gain precise insights into the internal process and their efficiency in particular. In turn, customer onboarding metrics show the actual effectiveness of the business. These metrics help identify potential issues and opportunities for improvement.
Customer Engagement
Tracking customer engagement is essential in the onboarding process. You will be able to oversee the onboarding process, instantly react in case of occurring problems and solve them as quickly as possible. Here are the main areas which you can track:
Login activity
How many customers are logging in? How frequently are they logging in? Answers to these questions will help you understand what percentage of the customers are more likely to benefit from your product. Low login activity should be a signal that something is not working properly and you have to be intensive to assist customers in reaching their core goal. It will be an aid to reduce the potential for customer churn.
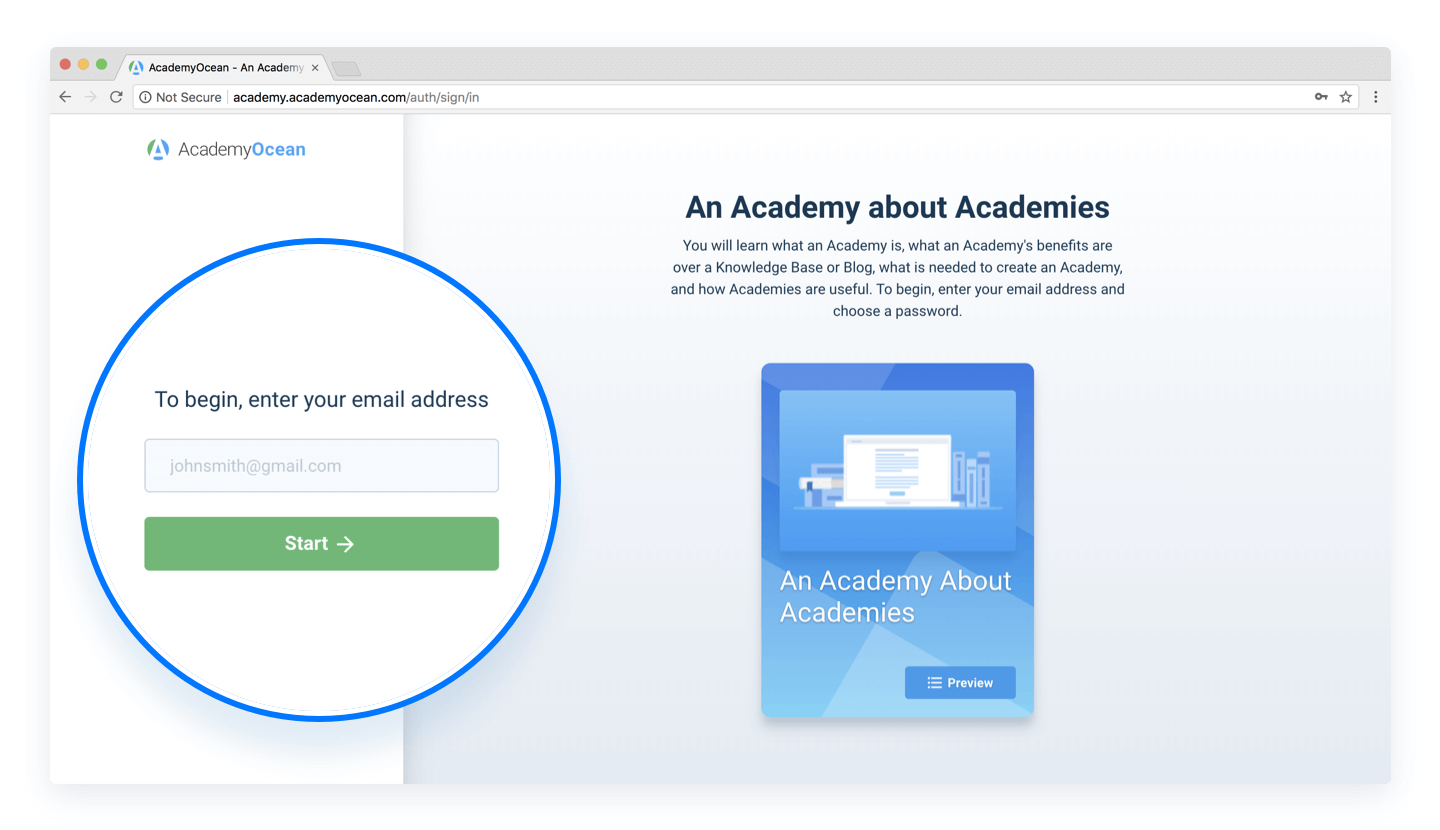
Onboarding academies in AcademyOcean are structured in ways that for the first time customers enter your academy they see only attractive landing page. They can see a course preview, but they can’t open the course itself until they enter their email address. That’s when lead capture happens. Every learner must enter their email address to get into your Academy. Because of this essential step, you can track how every user interacts with your Academy content.


Feature usage
What and how many features customers emphasize the most? Where they spend their time passing through your onboarding platform? High usage shows those parts of your product that are the most important and precious for your customers. These insights will help you understand what customers actually want and how you can improve your onboarding platform.
Using academies visitors explore your content in a very clear, structured manner. Interactive elements and gamified progress help keep their focus while reading. Moreover, you are able to get detailed statistics. With every action a learner takes, you get more data about them.
Onboarding abandonment
If customers stop the onboarding process before they understand what benefits they can get from your product, there is an opportunity for you to be proactive and analyze the reasons for a breakdown.
Using academies as your onboarding tool you can not only see the most active learners, but you can also collect full statistics about your content. This data tells you which sections are most interesting to your audience. It is represented as Learner Funnels. They show the breakdown of all the courses and lessons people go through.

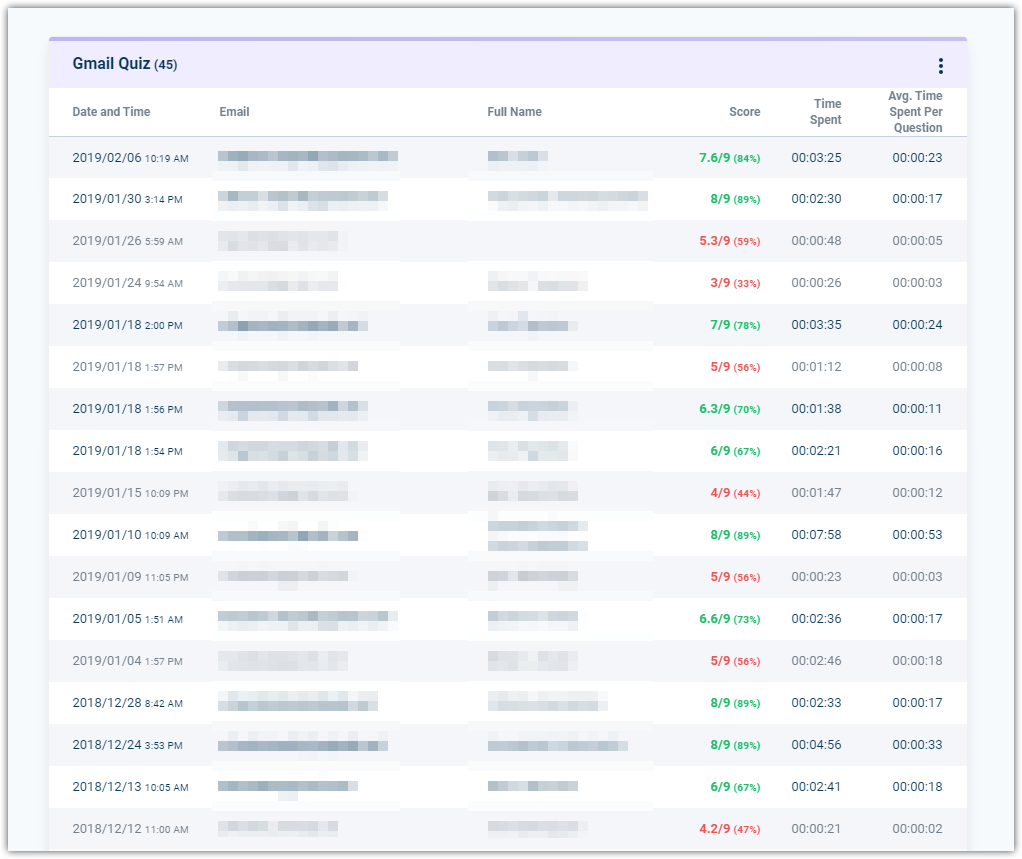
To make sure that your learners don’t just click through your onboarding you may use Quiz Feature. It is a very convenient feedback tool that will show your learners’ progress. Also, you can add a certificate that customers who successfully completed all of your lessons will receive.
Quiz results will show you who easily passed the education and who had some problems. So it will be a call for you to contact these learners and help them.

Another thing in academies that you can use to track your customers’ achievements is the Scoreboard or Top Learners section. It shows you the list of the best learners, so you can congratulate them personally.

The essential thing you should remember is that onboarding is a continuous process. If you don’t track the activity of your learners you will never know where you are succeeding or failing. To plan long-term relationships with your customers you should build a trustworthy onboarding and help your customers achieve their desired business outcomes with your product.


